ID and Version
ID and Version
Each row represents a unique request, identified by an ID and version
number. Use these to track specific invocations of your endpoint.
Source
Source
Indicates the origin of the request (e.g., “Replicate App”). This helps you
identify which integrations or applications are using your endpoint.
Status
Status
Shows the current state of each request. “Complete” indicates successful
processing. Monitor this column for any non-complete statuses that may
require attention.
Performance Metrics
Performance Metrics
- Total Time Taken: The overall processing duration for each request. - LLM Total Token: The number of tokens processed by the language model. - LLM Time Taken: Time specifically spent on language model operations. Use these metrics to identify performance bottlenecks or unexpected behavior.
Created Date
Created Date
The timestamp when the request was initiated. This helps in tracking the
timeline of requests and identifying patterns over time.
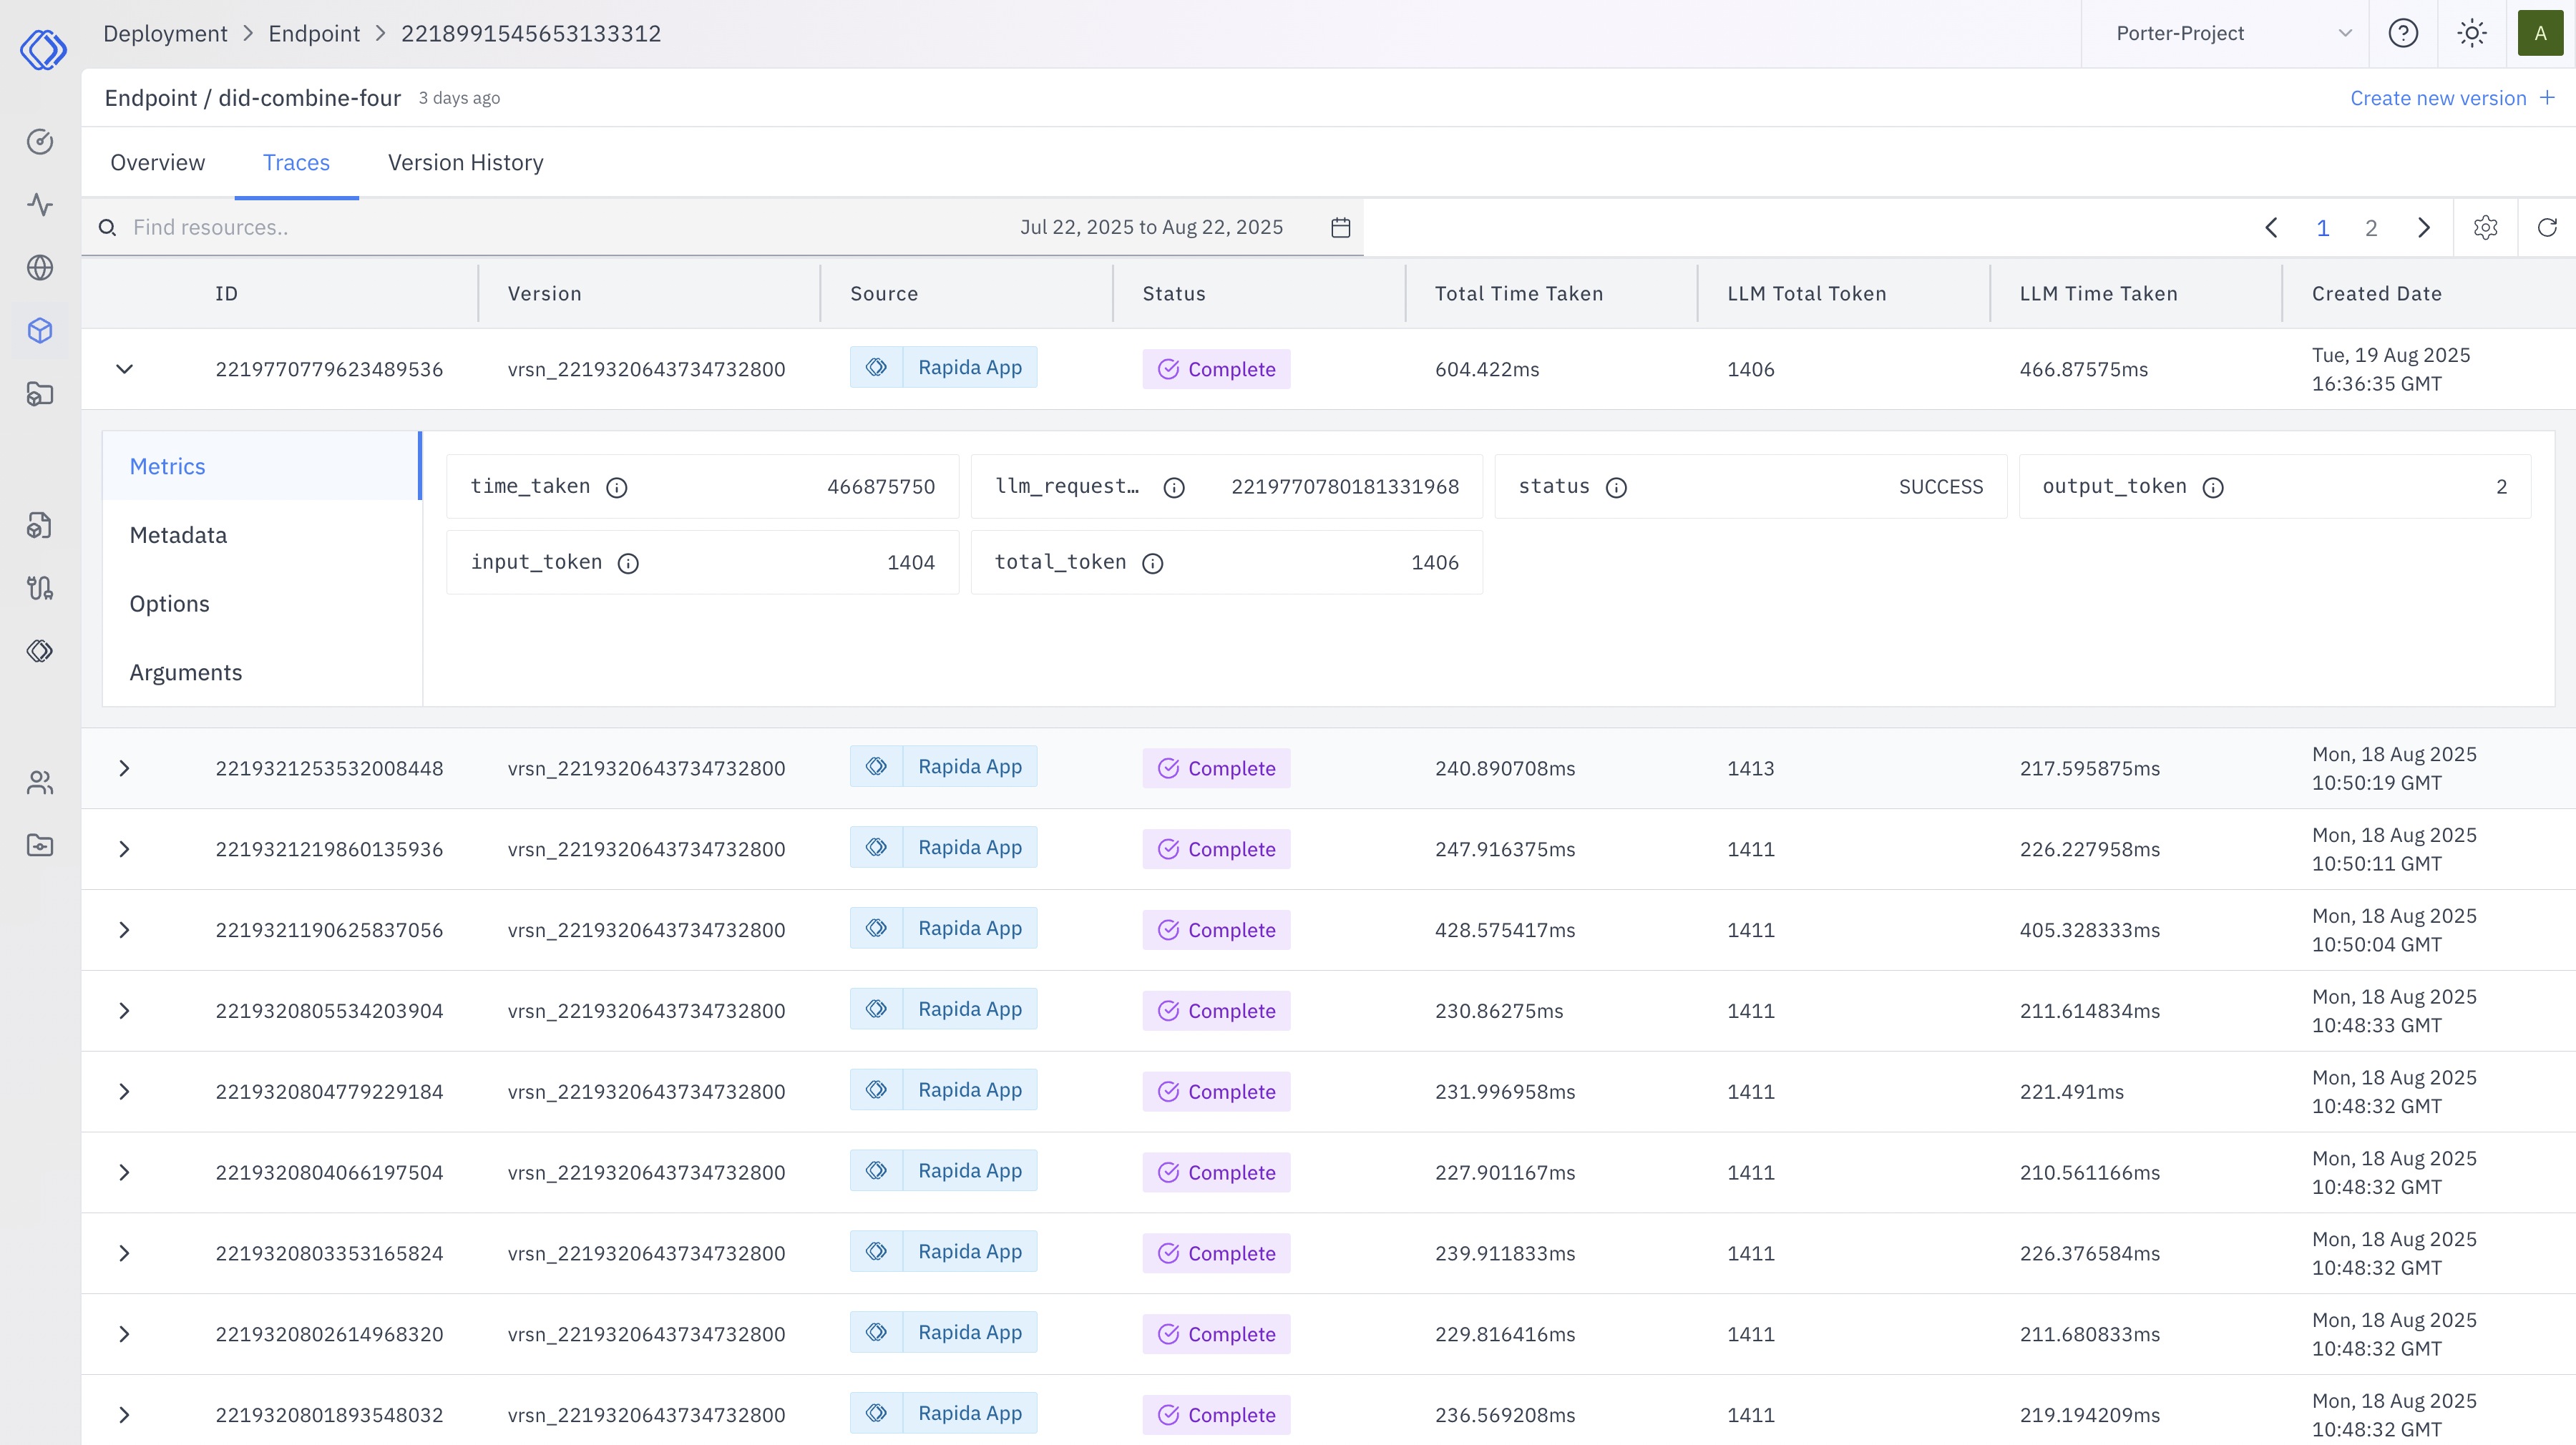
Detailed Request Information
When monitoring your endpoint performance, you can expand individual requests to access detailed information. This feature provides in-depth insights into each request, helping you analyze performance, troubleshoot issues, and understand how your endpoint is being used. To view detailed information for a specific request:- Locate the request you want to examine in your monitoring dashboard.
- Click on the request to expand its details.
- You’ll see a tabbed interface with the following sections:
Metrics
View detailed performance data for the request, including:- Time taken to process the request
- LLM request ID
- Request status
Metadata
Access additional context about the request. This information is helpful for understanding the request’s parameters and overall configuration.Options
Review the configuration settings used for this specific request. This tab is useful to ensure the endpoint was called with the expected options and to verify any custom settings applied.Arguments
Examine the input parameters provided to the endpoint for this request. This tab is particularly useful for:- Reproducing issues
- Understanding how your endpoint is being used in practice
- Verifying the correct inputs were sent to the endpoint
Debugging Techniques
When investigating issues or optimizing performance:- Analyze Trends: Look for patterns in the Total Time Taken or LLM Time Taken across requests. Sudden increases may indicate performance degradation.
- Compare Versions: Use the version history to identify if recent changes have impacted performance or reliability.
- Inspect Failures: For any non-”Complete” statuses, expand the request details to examine metrics, options, and arguments for clues about what went wrong.
- Token Usage: Monitor the LLM Total Token to ensure it aligns with expectations and to manage costs effectively.
- Source Analysis: If issues are isolated to specific sources, it may indicate problems with particular integrations or client implementations.
Advanced Monitoring
For more in-depth analysis:LLM Logs
Access detailed logs of language model operations for advanced debugging.
These logs provide insights into the internal workings of the LLM during
request processing.
SDK & Integration
Consult the SDK documentation for implementation details and best practices
for client integration. Proper SDK usage can prevent many common issues and
optimize endpoint interaction.