> ## Documentation Index
> Fetch the complete documentation index at: https://doc.rapida.ai/llms.txt
> Use this file to discover all available pages before exploring further.
# Webhook Logs
> Monitor and analyze webhook interactions in the Rapida platform
The Webhook Logs feature provides detailed information about webhook requests and responses, allowing you to monitor and analyze the performance and behavior of webhook interactions within your system.
## Log Overview
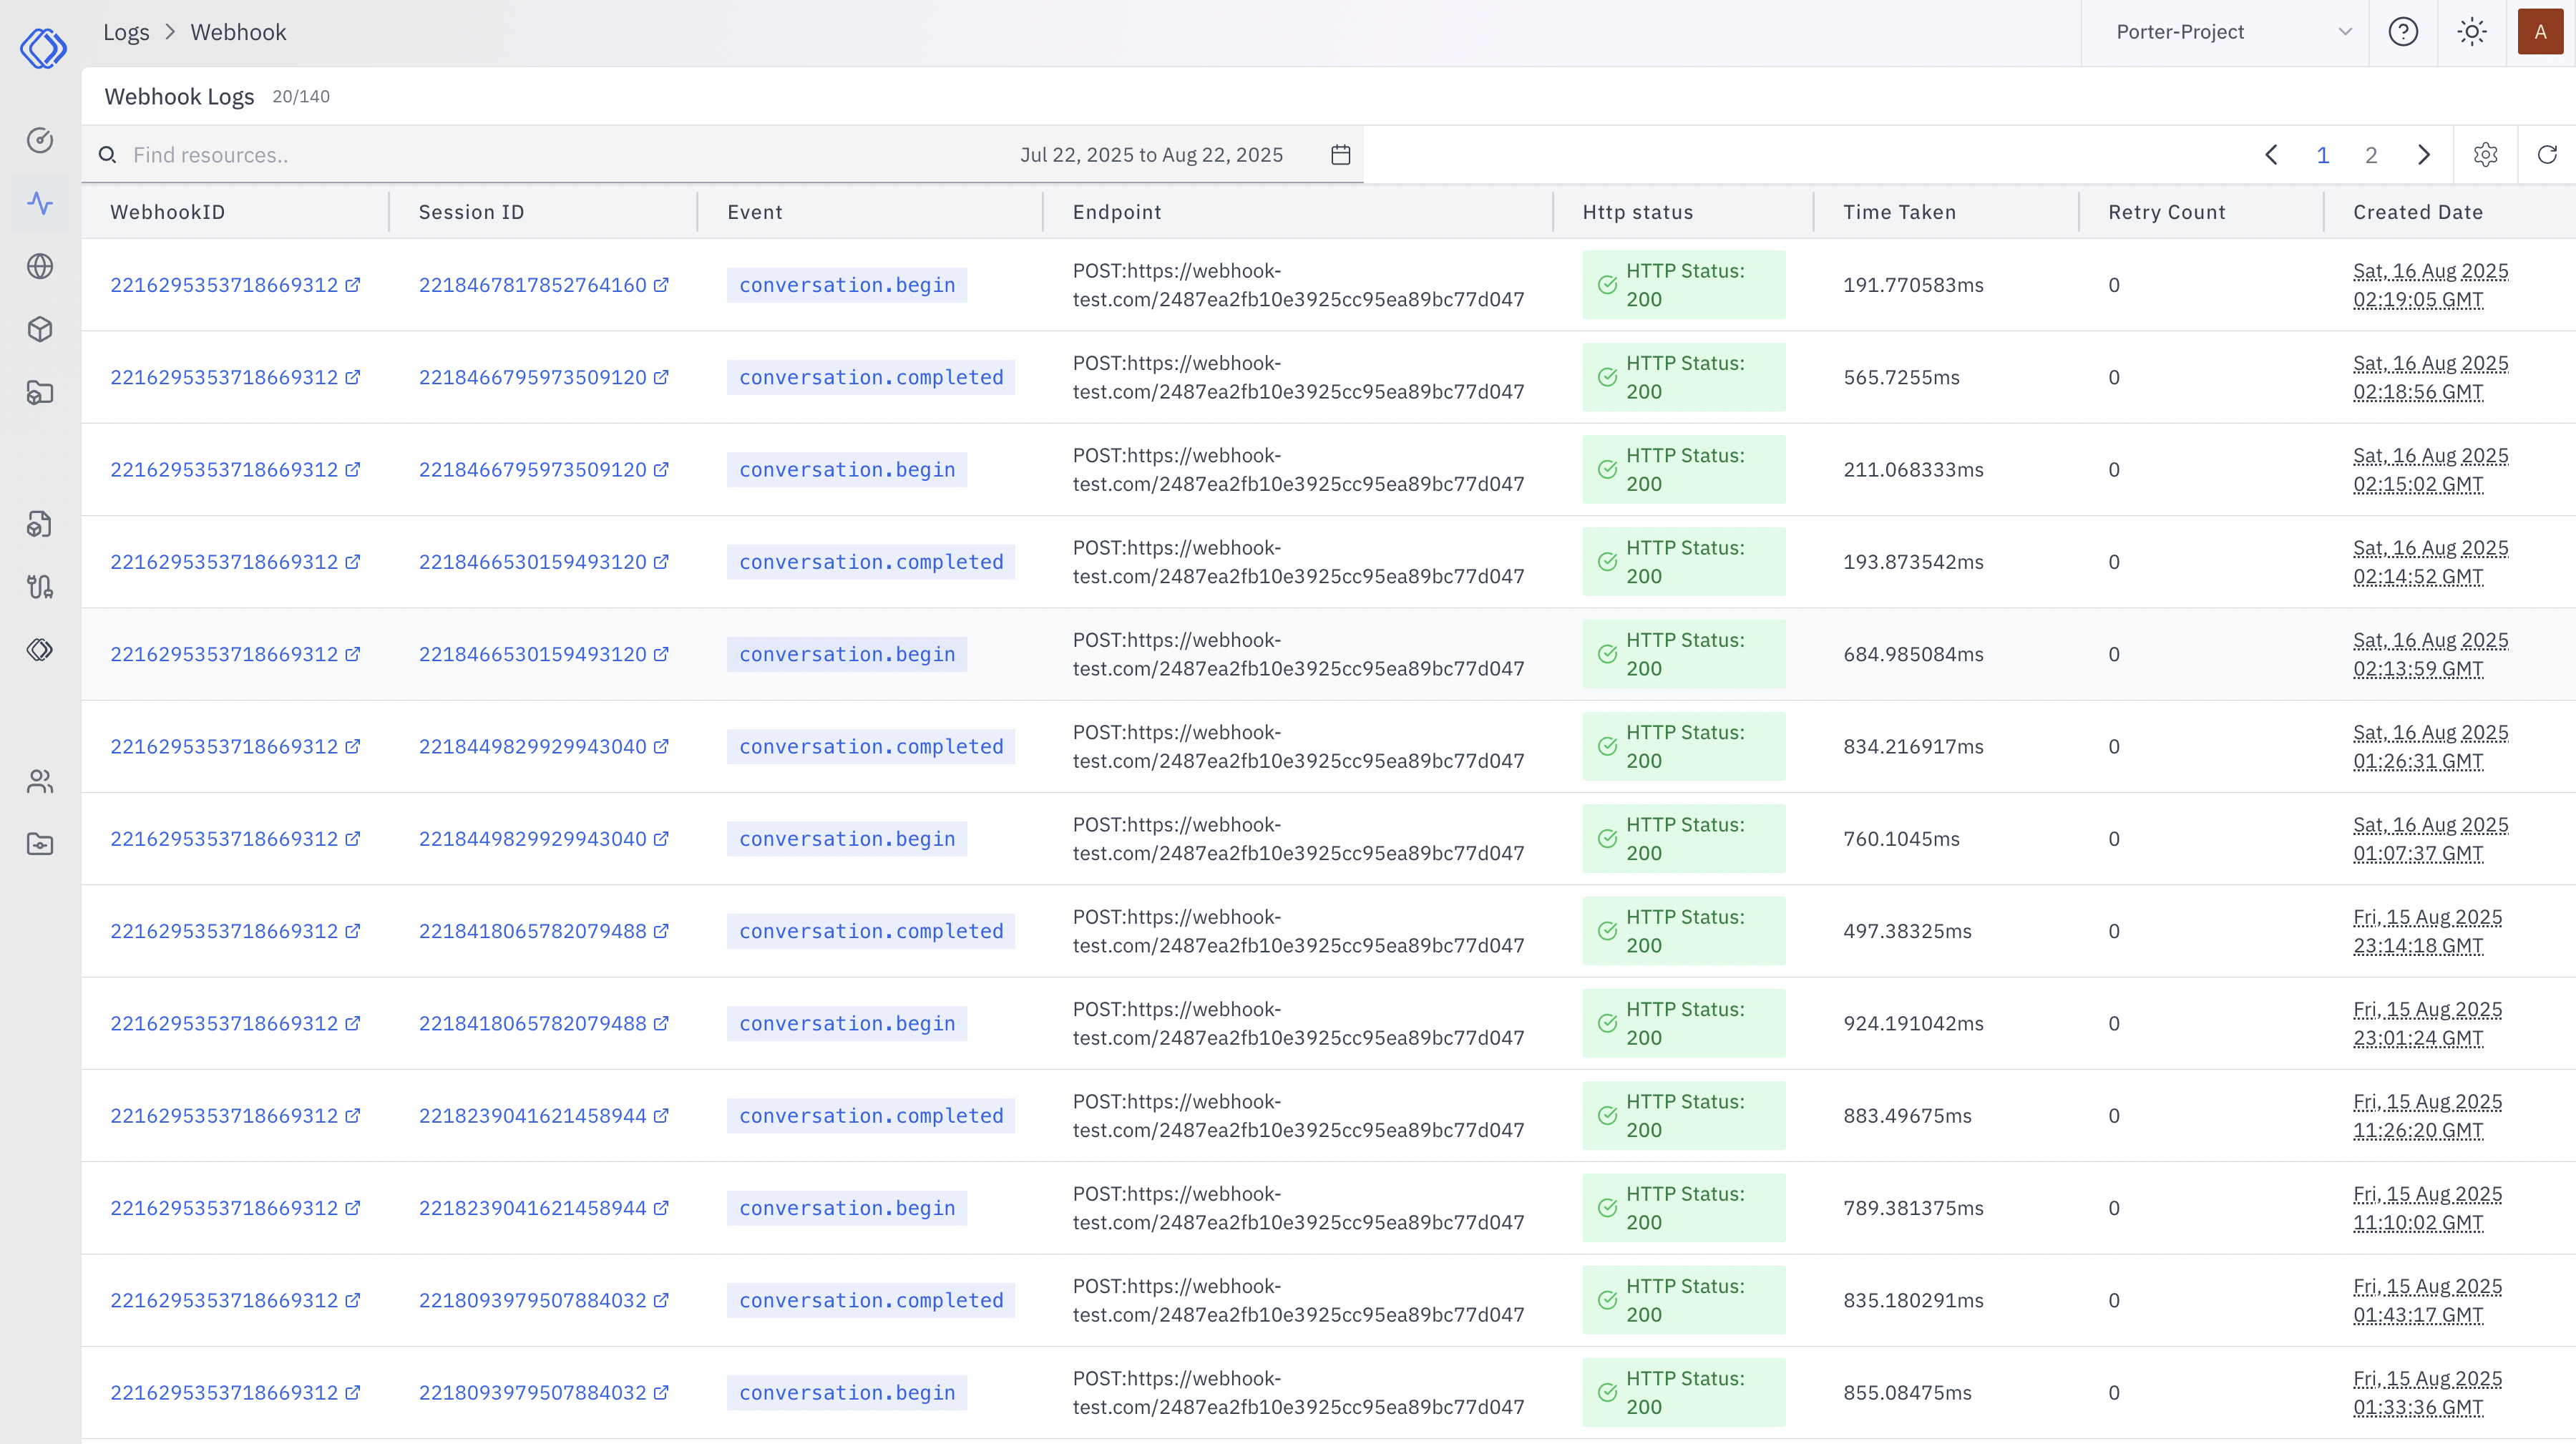 The main log view displays a table with the following columns:
* **Webhook ID**: Unique identifier for each webhook
* **Session ID**: Identifier for the session associated with the webhook
* **Event**: Type of event, such as `call.received`, `call.ringing`, `call.ended`, `webrtc.connected`, `webrtc.reconnecting`, `conversation.begin`, `conversation.completed`, or `conversation.error`
* **Endpoint**: The URL endpoint where the webhook is sent
* **HTTP Status**: Response status code (e.g., 200 for success)
* **Time Taken**: Processing time for the request in milliseconds
* **Retry Count**: Number of retry attempts, if any
* **Created Date**: Timestamp of when the webhook was triggered
## Detailed Log Entry
Clicking on a log entry reveals more detailed information, divided into two tabs:
### Request
The main log view displays a table with the following columns:
* **Webhook ID**: Unique identifier for each webhook
* **Session ID**: Identifier for the session associated with the webhook
* **Event**: Type of event, such as `call.received`, `call.ringing`, `call.ended`, `webrtc.connected`, `webrtc.reconnecting`, `conversation.begin`, `conversation.completed`, or `conversation.error`
* **Endpoint**: The URL endpoint where the webhook is sent
* **HTTP Status**: Response status code (e.g., 200 for success)
* **Time Taken**: Processing time for the request in milliseconds
* **Retry Count**: Number of retry attempts, if any
* **Created Date**: Timestamp of when the webhook was triggered
## Detailed Log Entry
Clicking on a log entry reveals more detailed information, divided into two tabs:
### Request
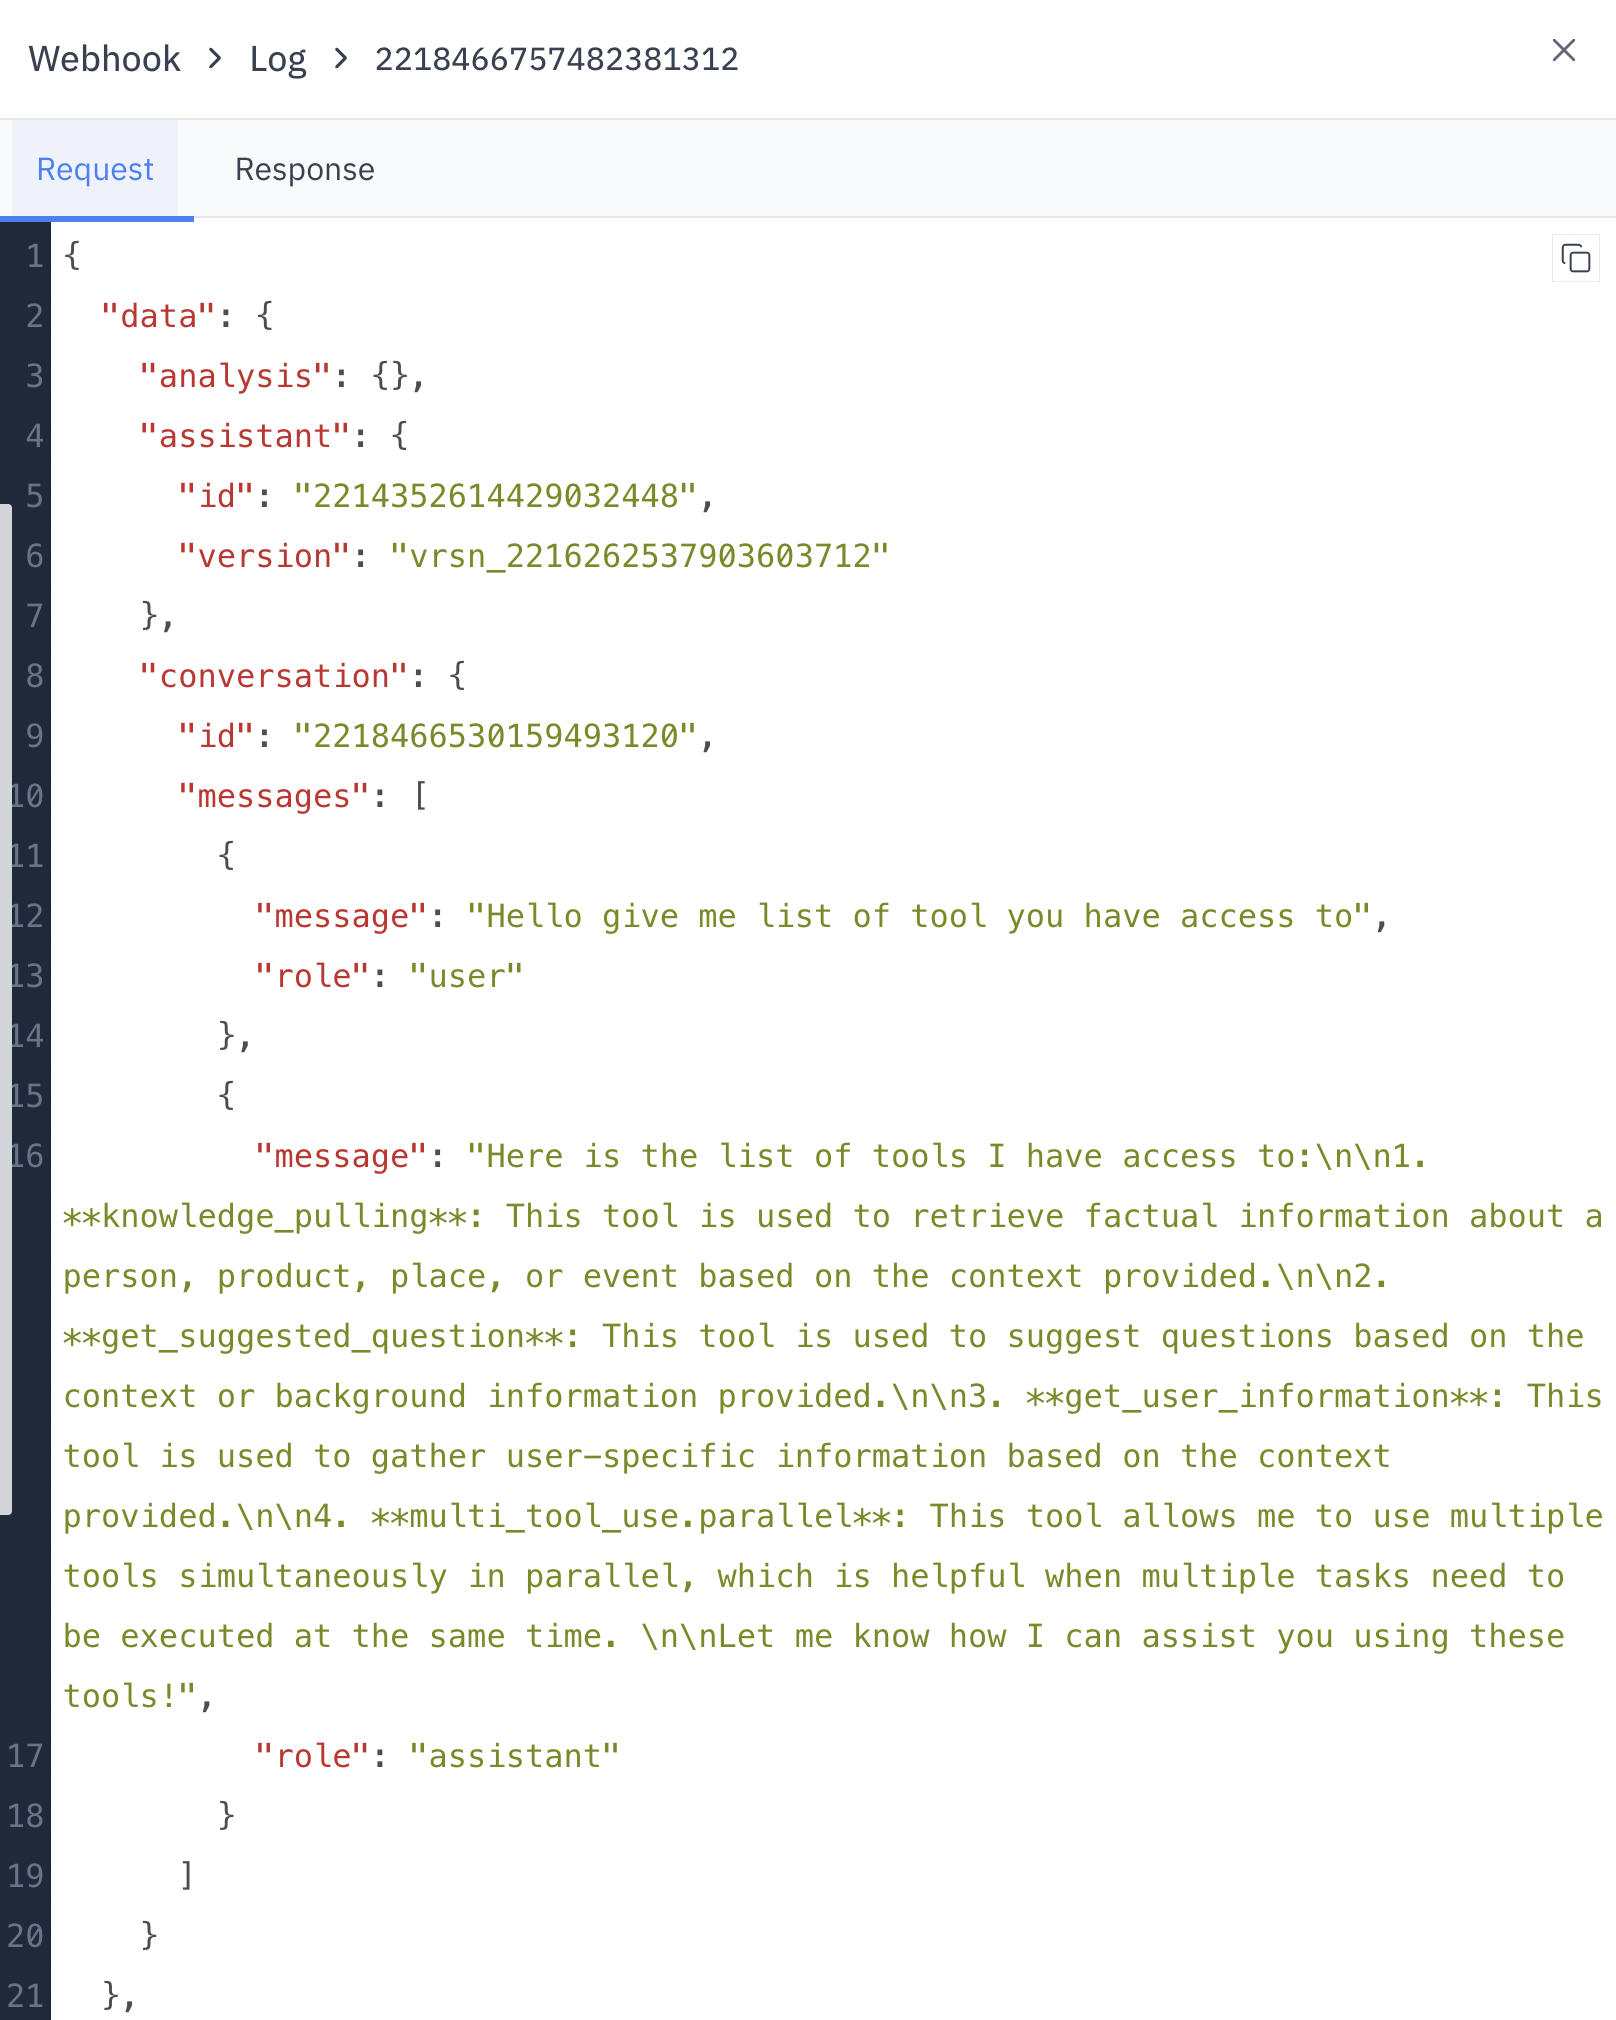 Contains the JSON payload sent to your webhook endpoint:
* **event**: Event name that triggered delivery.
* **assistant**: Assistant context, including the assistant ID.
* **conversation**: Conversation context, including the conversation ID when available.
* **data**: Event-specific data. For call events, this can include call status, provider, direction, context ID, channel UUID, failure reason, or duration when available. For WebRTC events, this can include session ID, media session ID, codec, ICE latency, peer connection state, reconnect reason, or recovery counters when available. For `conversation.completed`, this includes:
* **reason**: Completion reason, usually `conversation_completed`.
* **status**: Final conversation status.
* **messages**: Transcript entries with message ID, role, and content.
* **metadata**: Conversation metadata, including successful analysis results under `analysis.`.
* **metrics**: Conversation metrics recorded during the session.
### Response
Contains the JSON payload sent to your webhook endpoint:
* **event**: Event name that triggered delivery.
* **assistant**: Assistant context, including the assistant ID.
* **conversation**: Conversation context, including the conversation ID when available.
* **data**: Event-specific data. For call events, this can include call status, provider, direction, context ID, channel UUID, failure reason, or duration when available. For WebRTC events, this can include session ID, media session ID, codec, ICE latency, peer connection state, reconnect reason, or recovery counters when available. For `conversation.completed`, this includes:
* **reason**: Completion reason, usually `conversation_completed`.
* **status**: Final conversation status.
* **messages**: Transcript entries with message ID, role, and content.
* **metadata**: Conversation metadata, including successful analysis results under `analysis.`.
* **metrics**: Conversation metrics recorded during the session.
### Response
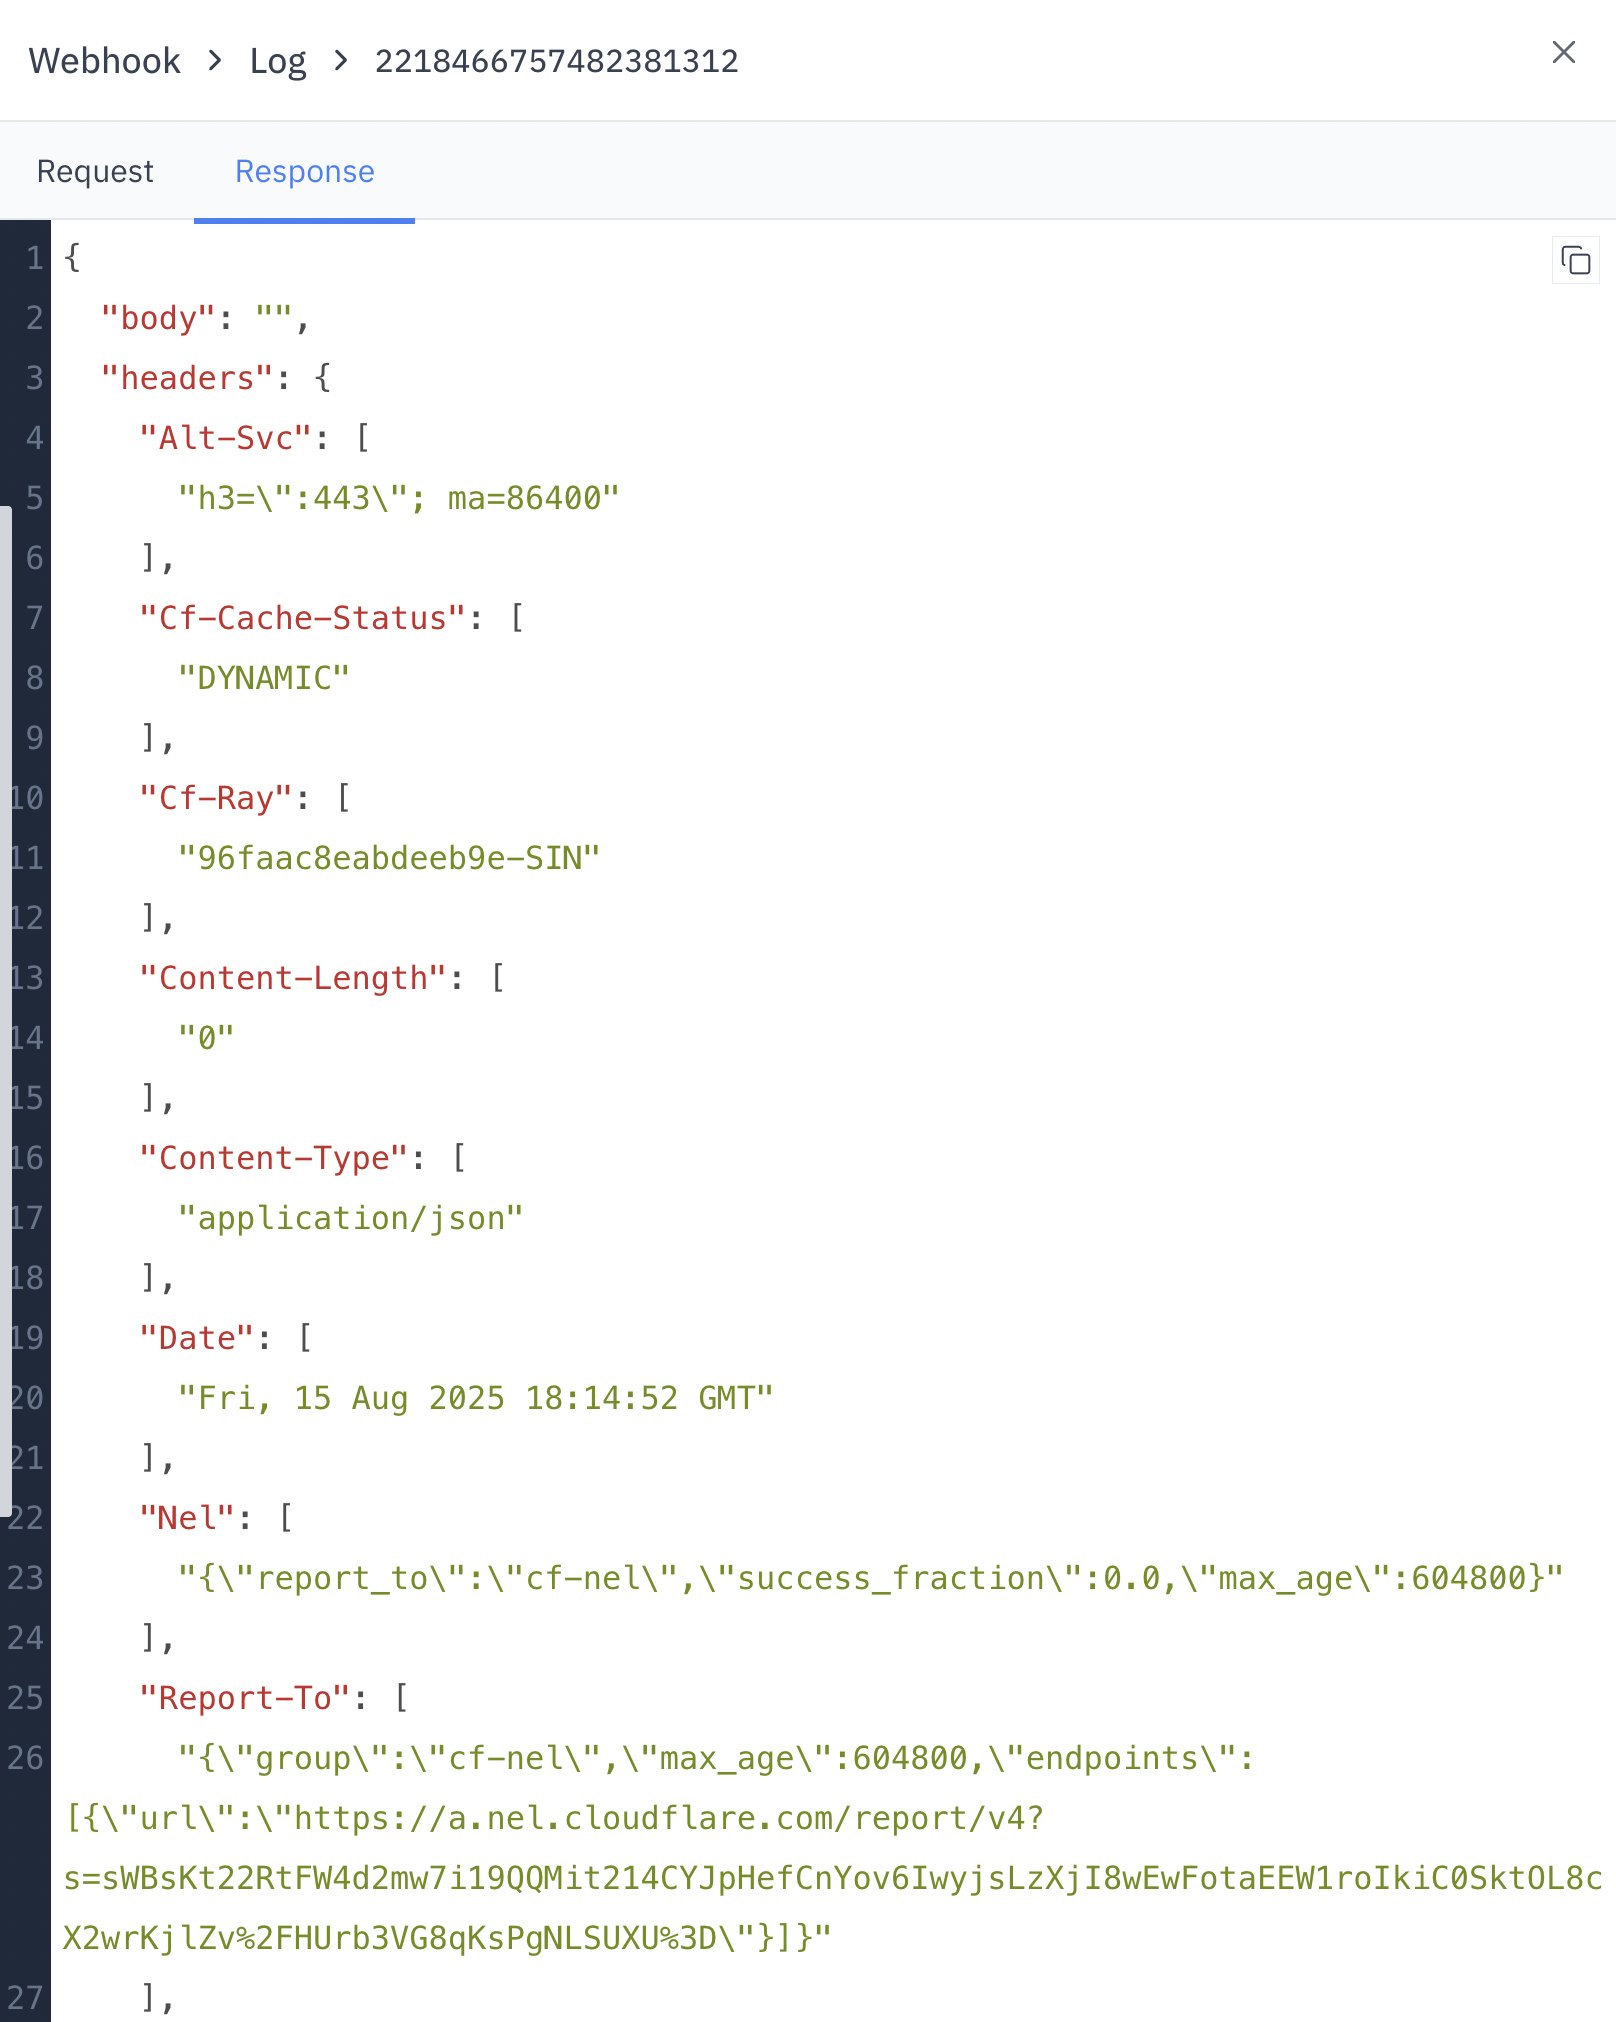 Shows the response details from the webhook endpoint:
* **body**: The response body (empty in this example)
* **headers**: Various HTTP headers in the response
* **Alt-Svc**: Alternative services information
* **Cf-Cache-Status**: Cloudflare cache status
* **Cf-Ray**: Cloudflare Ray ID for the request
* **Content-Length**: Length of the response content
* **Content-Type**: MIME type of the response
* **Date**: Timestamp of the response
* **Nel**: Network Error Logging information
* **Report-To**: Reporting API configuration
## Using Webhook Logs
1. **Integration Monitoring**: Track successful and failed webhook deliveries to ensure your integrations are working correctly.
2. **Debugging**: Investigate issues by examining the full request and response details for each webhook.
3. **Performance Analysis**: Monitor response times and success rates to optimize your webhook-based processes.
4. **Security Auditing**: Review webhook payloads and endpoints to ensure data is being sent to and received from authorized sources.
## Use Cases
Quickly identify and resolve issues with third-party integrations by
examining detailed webhook logs.
Track call, WebRTC, and conversation events and ensure they are being properly transmitted to
external systems.
Analyze response times and success rates to improve the efficiency of your
webhook-based processes.
Verify that webhook payloads contain the expected data and are being sent to
the correct endpoints.
Shows the response details from the webhook endpoint:
* **body**: The response body (empty in this example)
* **headers**: Various HTTP headers in the response
* **Alt-Svc**: Alternative services information
* **Cf-Cache-Status**: Cloudflare cache status
* **Cf-Ray**: Cloudflare Ray ID for the request
* **Content-Length**: Length of the response content
* **Content-Type**: MIME type of the response
* **Date**: Timestamp of the response
* **Nel**: Network Error Logging information
* **Report-To**: Reporting API configuration
## Using Webhook Logs
1. **Integration Monitoring**: Track successful and failed webhook deliveries to ensure your integrations are working correctly.
2. **Debugging**: Investigate issues by examining the full request and response details for each webhook.
3. **Performance Analysis**: Monitor response times and success rates to optimize your webhook-based processes.
4. **Security Auditing**: Review webhook payloads and endpoints to ensure data is being sent to and received from authorized sources.
## Use Cases
Quickly identify and resolve issues with third-party integrations by
examining detailed webhook logs.
Track call, WebRTC, and conversation events and ensure they are being properly transmitted to
external systems.
Analyze response times and success rates to improve the efficiency of your
webhook-based processes.
Verify that webhook payloads contain the expected data and are being sent to
the correct endpoints.