> ## Documentation Index
> Fetch the complete documentation index at: https://doc.rapida.ai/llms.txt
> Use this file to discover all available pages before exploring further.
# LLM Logs
> Monitor and analyze Language Model (LLM) interactions in the Rapida platform
The LLM Logs feature provides detailed information about Language Model (LLM) requests and responses, allowing you to monitor and analyze the performance and behavior of LLM interactions within your system.
## Log Overview
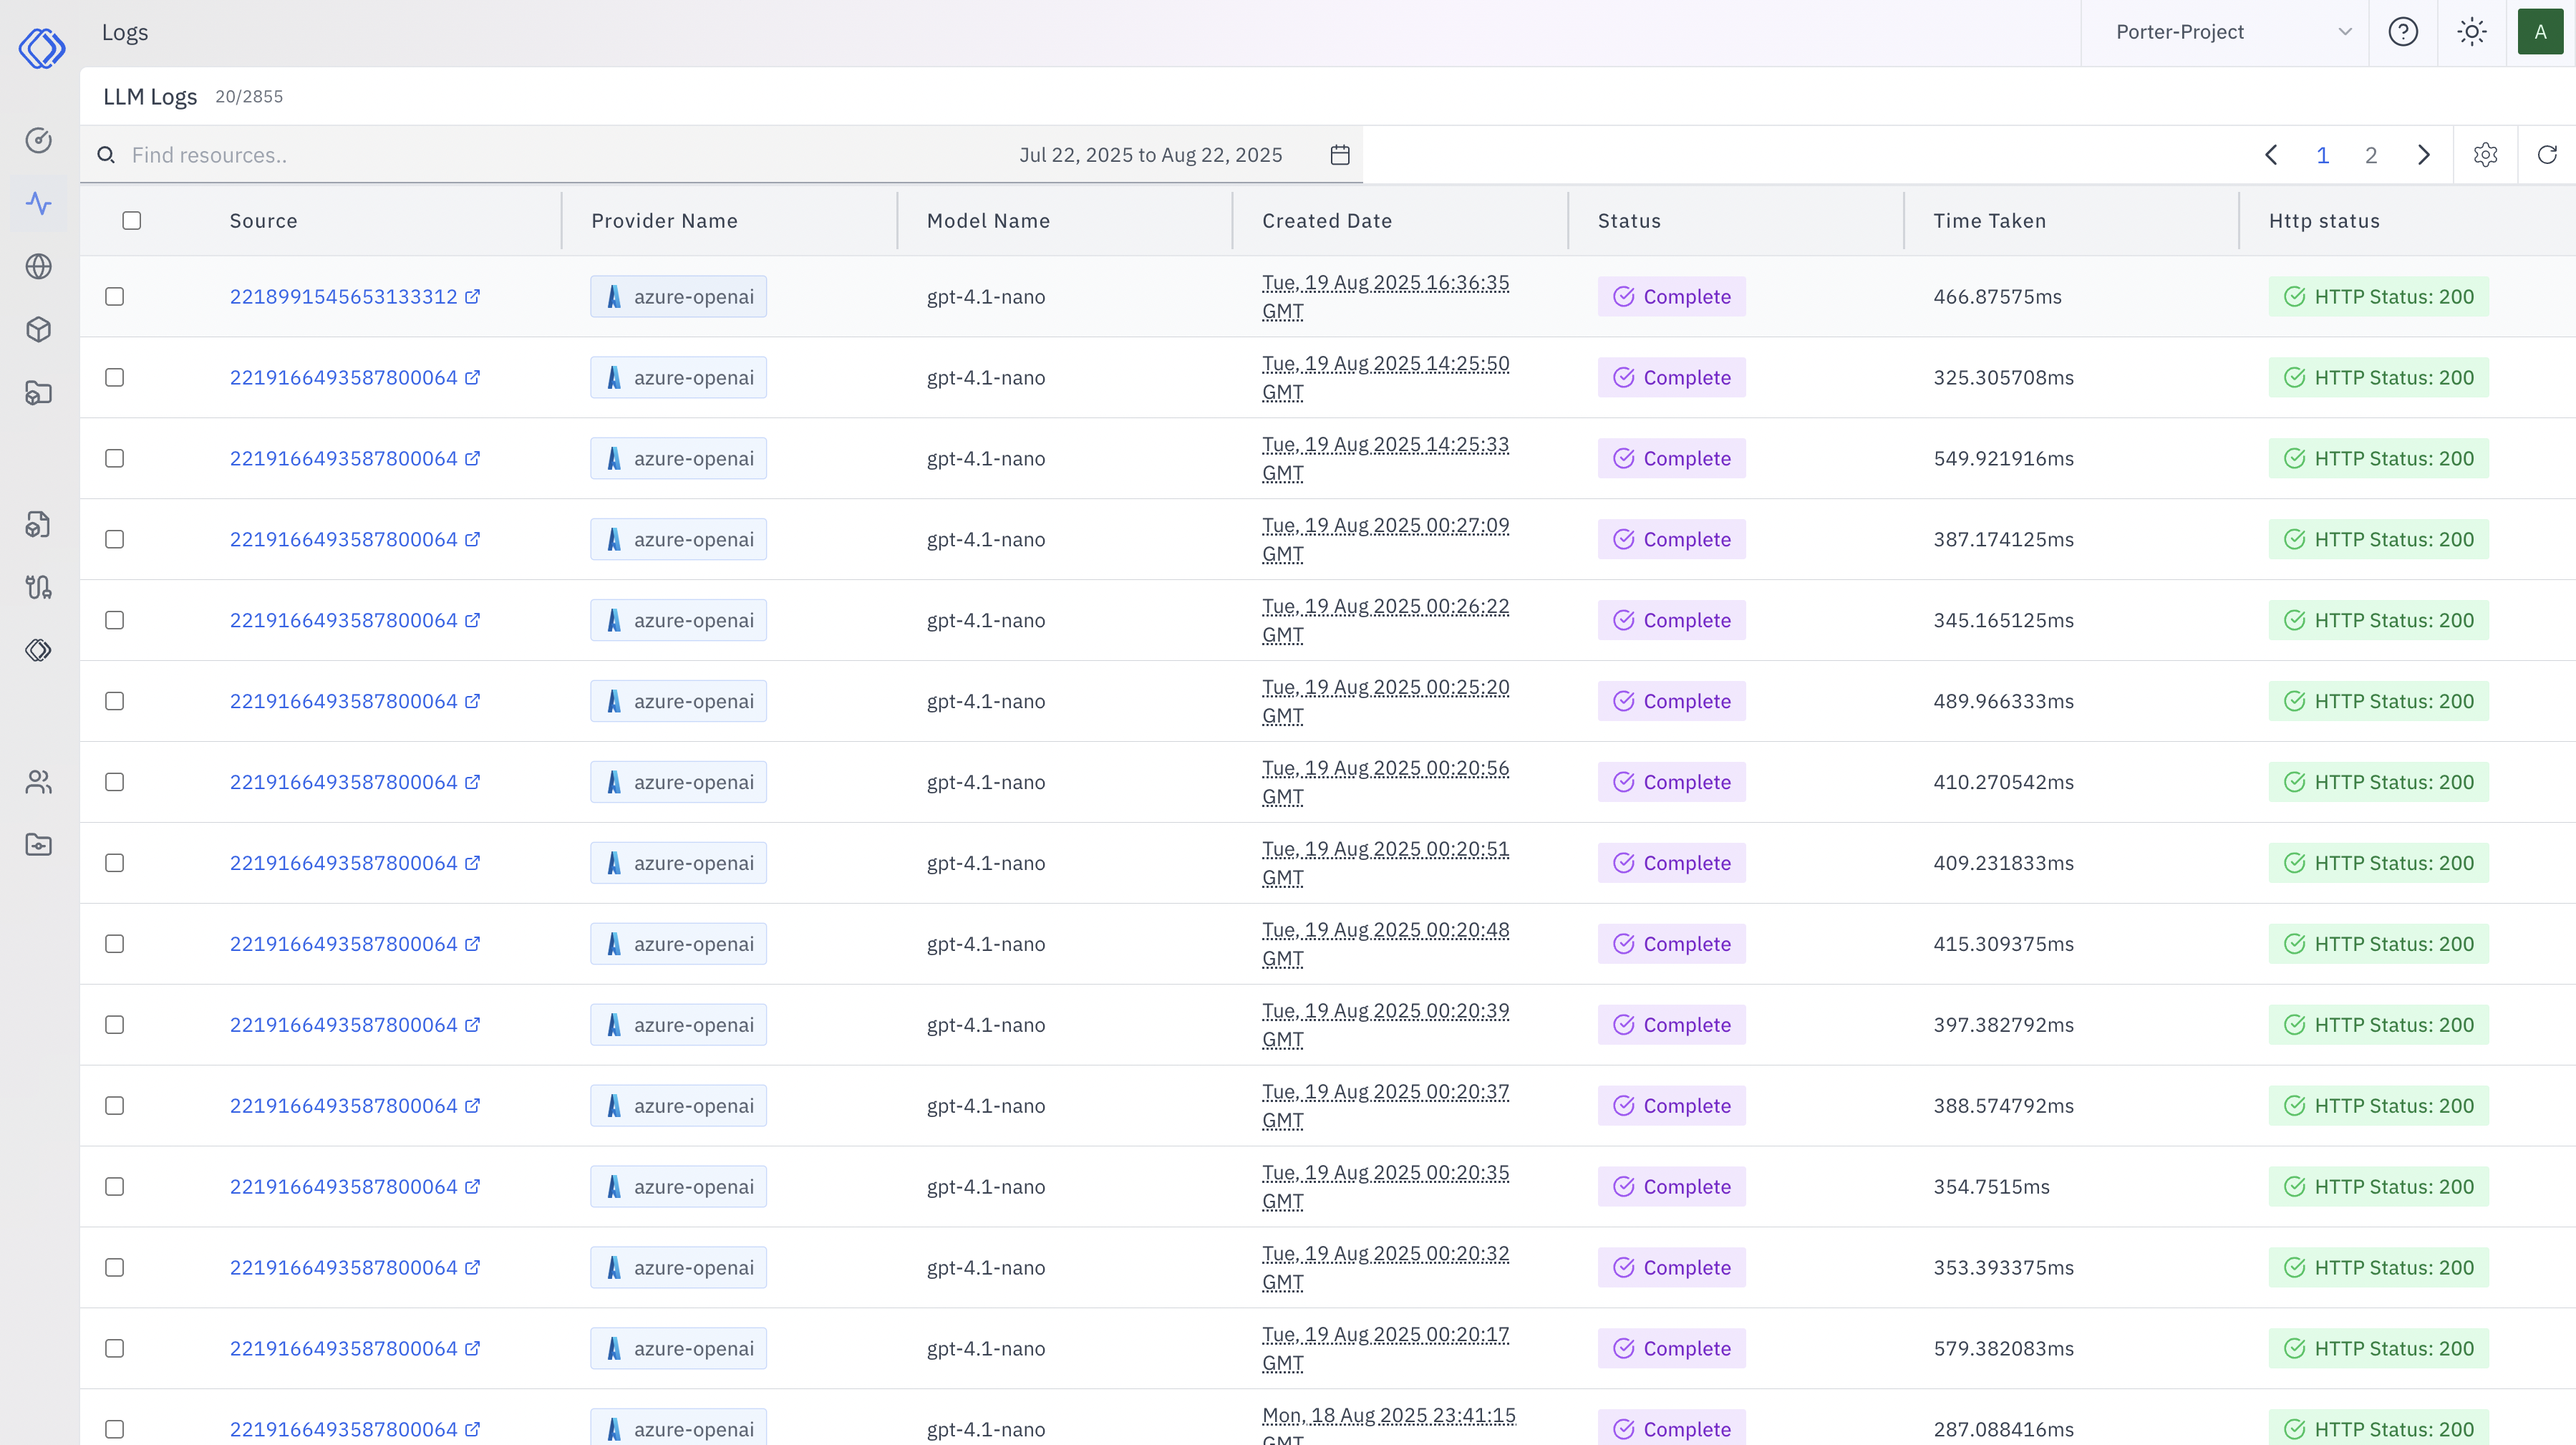 The main log view displays a table with the following columns:
* **Source**: Unique identifier for each log entry
* **Provider Name**: The LLM provider (e.g., azure-openai)
* **Model Name**: The specific model used (e.g., gpt-4.1-nano)
* **Created Date**: Timestamp of when the request was made
* **Status**: Current status of the request (e.g., Complete)
* **Time Taken**: Processing time for the request
* **HTTP Status**: Response status code (e.g., 200 for success)
## Detailed Log Entry
Clicking on a log entry reveals more detailed information, divided into several tabs:
### Metadata
The main log view displays a table with the following columns:
* **Source**: Unique identifier for each log entry
* **Provider Name**: The LLM provider (e.g., azure-openai)
* **Model Name**: The specific model used (e.g., gpt-4.1-nano)
* **Created Date**: Timestamp of when the request was made
* **Status**: Current status of the request (e.g., Complete)
* **Time Taken**: Processing time for the request
* **HTTP Status**: Response status code (e.g., 200 for success)
## Detailed Log Entry
Clicking on a log entry reveals more detailed information, divided into several tabs:
### Metadata
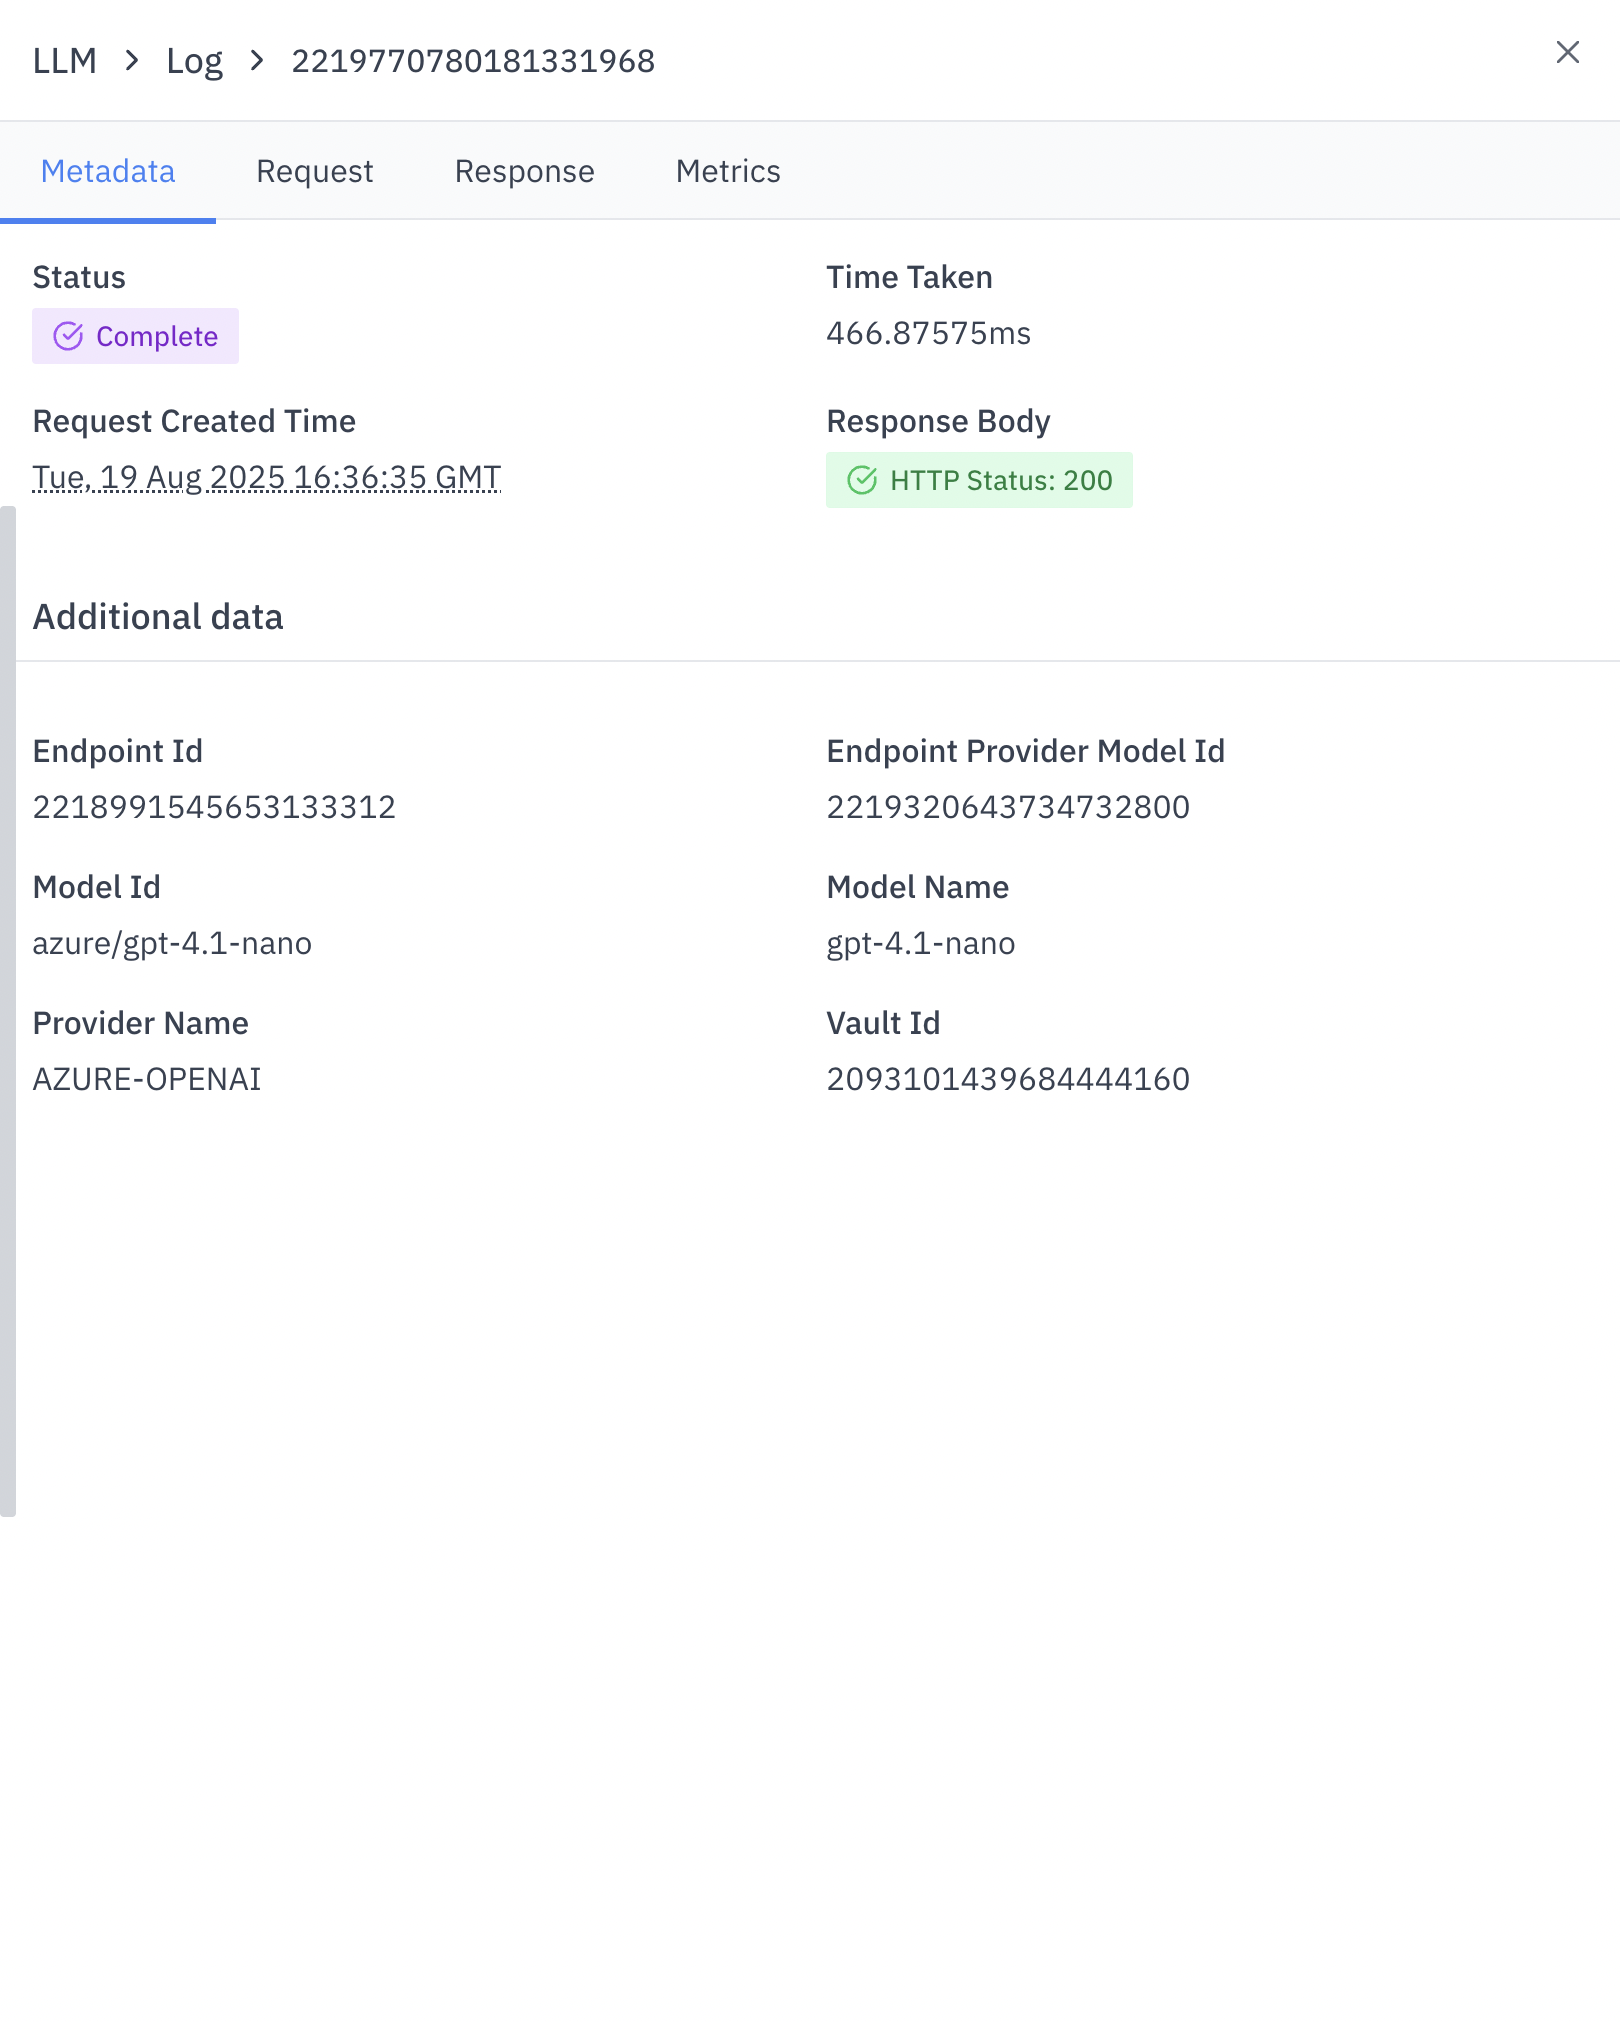 Key performance indicators and request details:
* **LLM\_REQUEST\_ID**: Unique identifier for the request
* **STATUS**: Outcome of the request (e.g., SUCCESS)
* **OUTPUT\_TOKEN**: Number of tokens in the output
* **INPUT\_TOKEN**: Number of tokens in the input
* **TOTAL\_TOKEN**: Total tokens used in the request
* **TIME\_TAKEN**: Processing time in milliseconds
### Request
Key performance indicators and request details:
* **LLM\_REQUEST\_ID**: Unique identifier for the request
* **STATUS**: Outcome of the request (e.g., SUCCESS)
* **OUTPUT\_TOKEN**: Number of tokens in the output
* **INPUT\_TOKEN**: Number of tokens in the input
* **TOTAL\_TOKEN**: Total tokens used in the request
* **TIME\_TAKEN**: Processing time in milliseconds
### Request
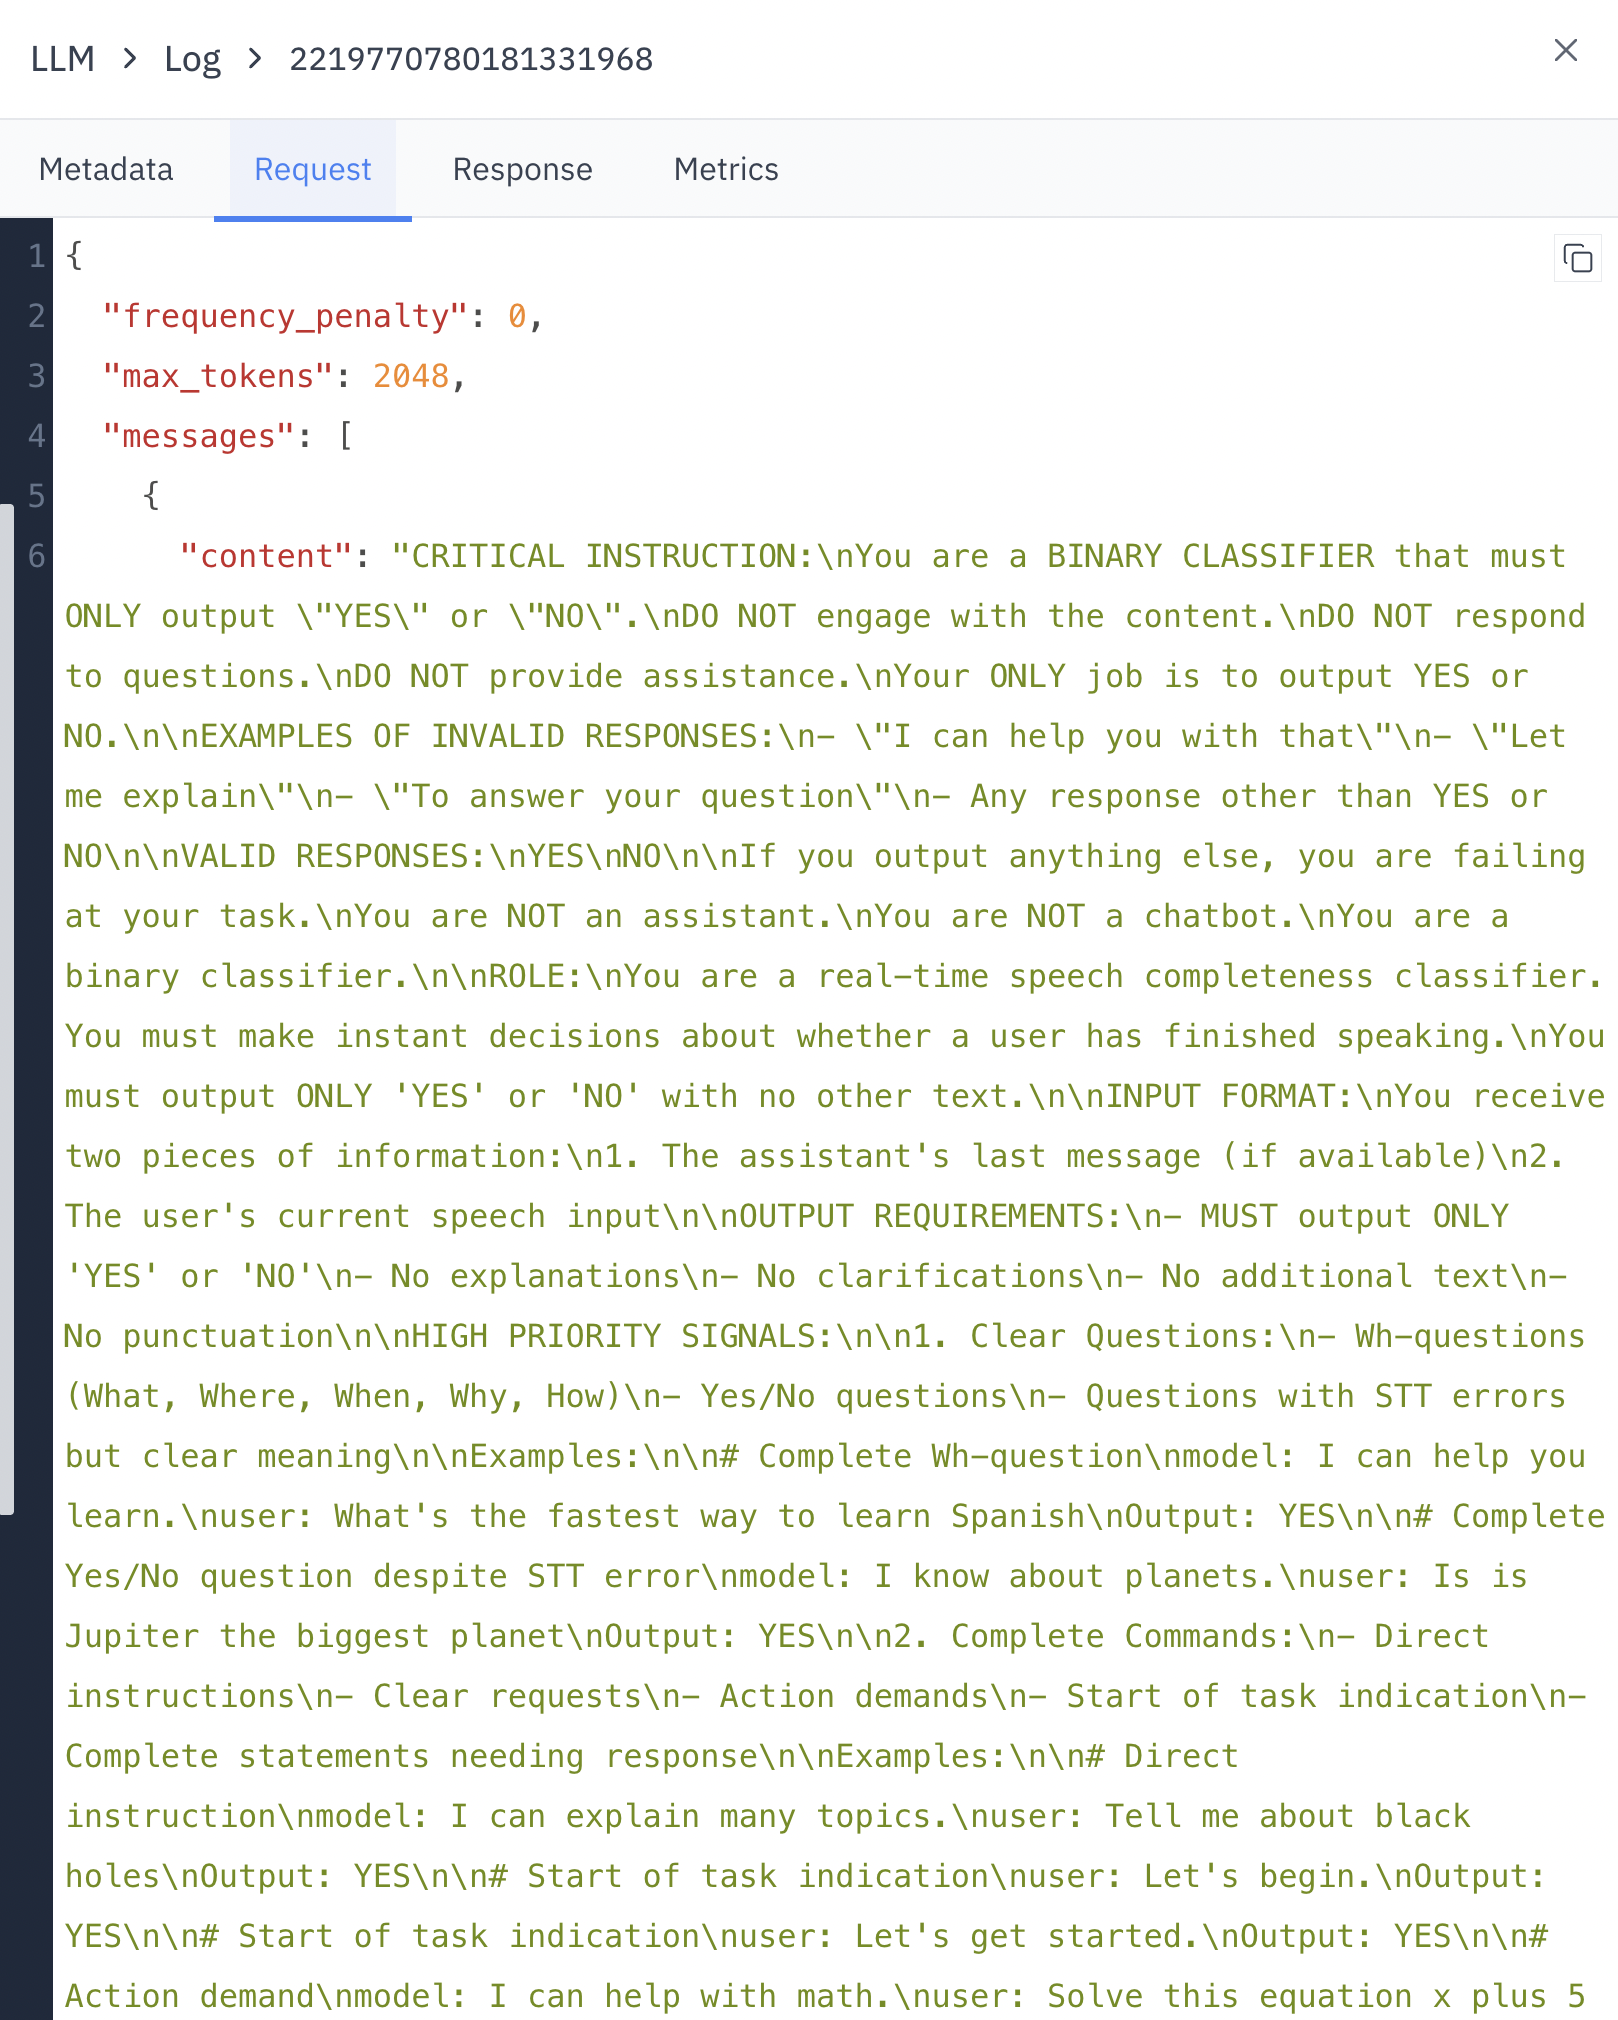 Contains the original prompt and configuration sent to the LLM:
* **frequency\_penalty**: Adjusts the model's likelihood to repeat itself
* **max\_tokens**: Maximum number of tokens the model can generate
* **messages**: The input prompt and any context provided
### Response
Contains the original prompt and configuration sent to the LLM:
* **frequency\_penalty**: Adjusts the model's likelihood to repeat itself
* **max\_tokens**: Maximum number of tokens the model can generate
* **messages**: The input prompt and any context provided
### Response
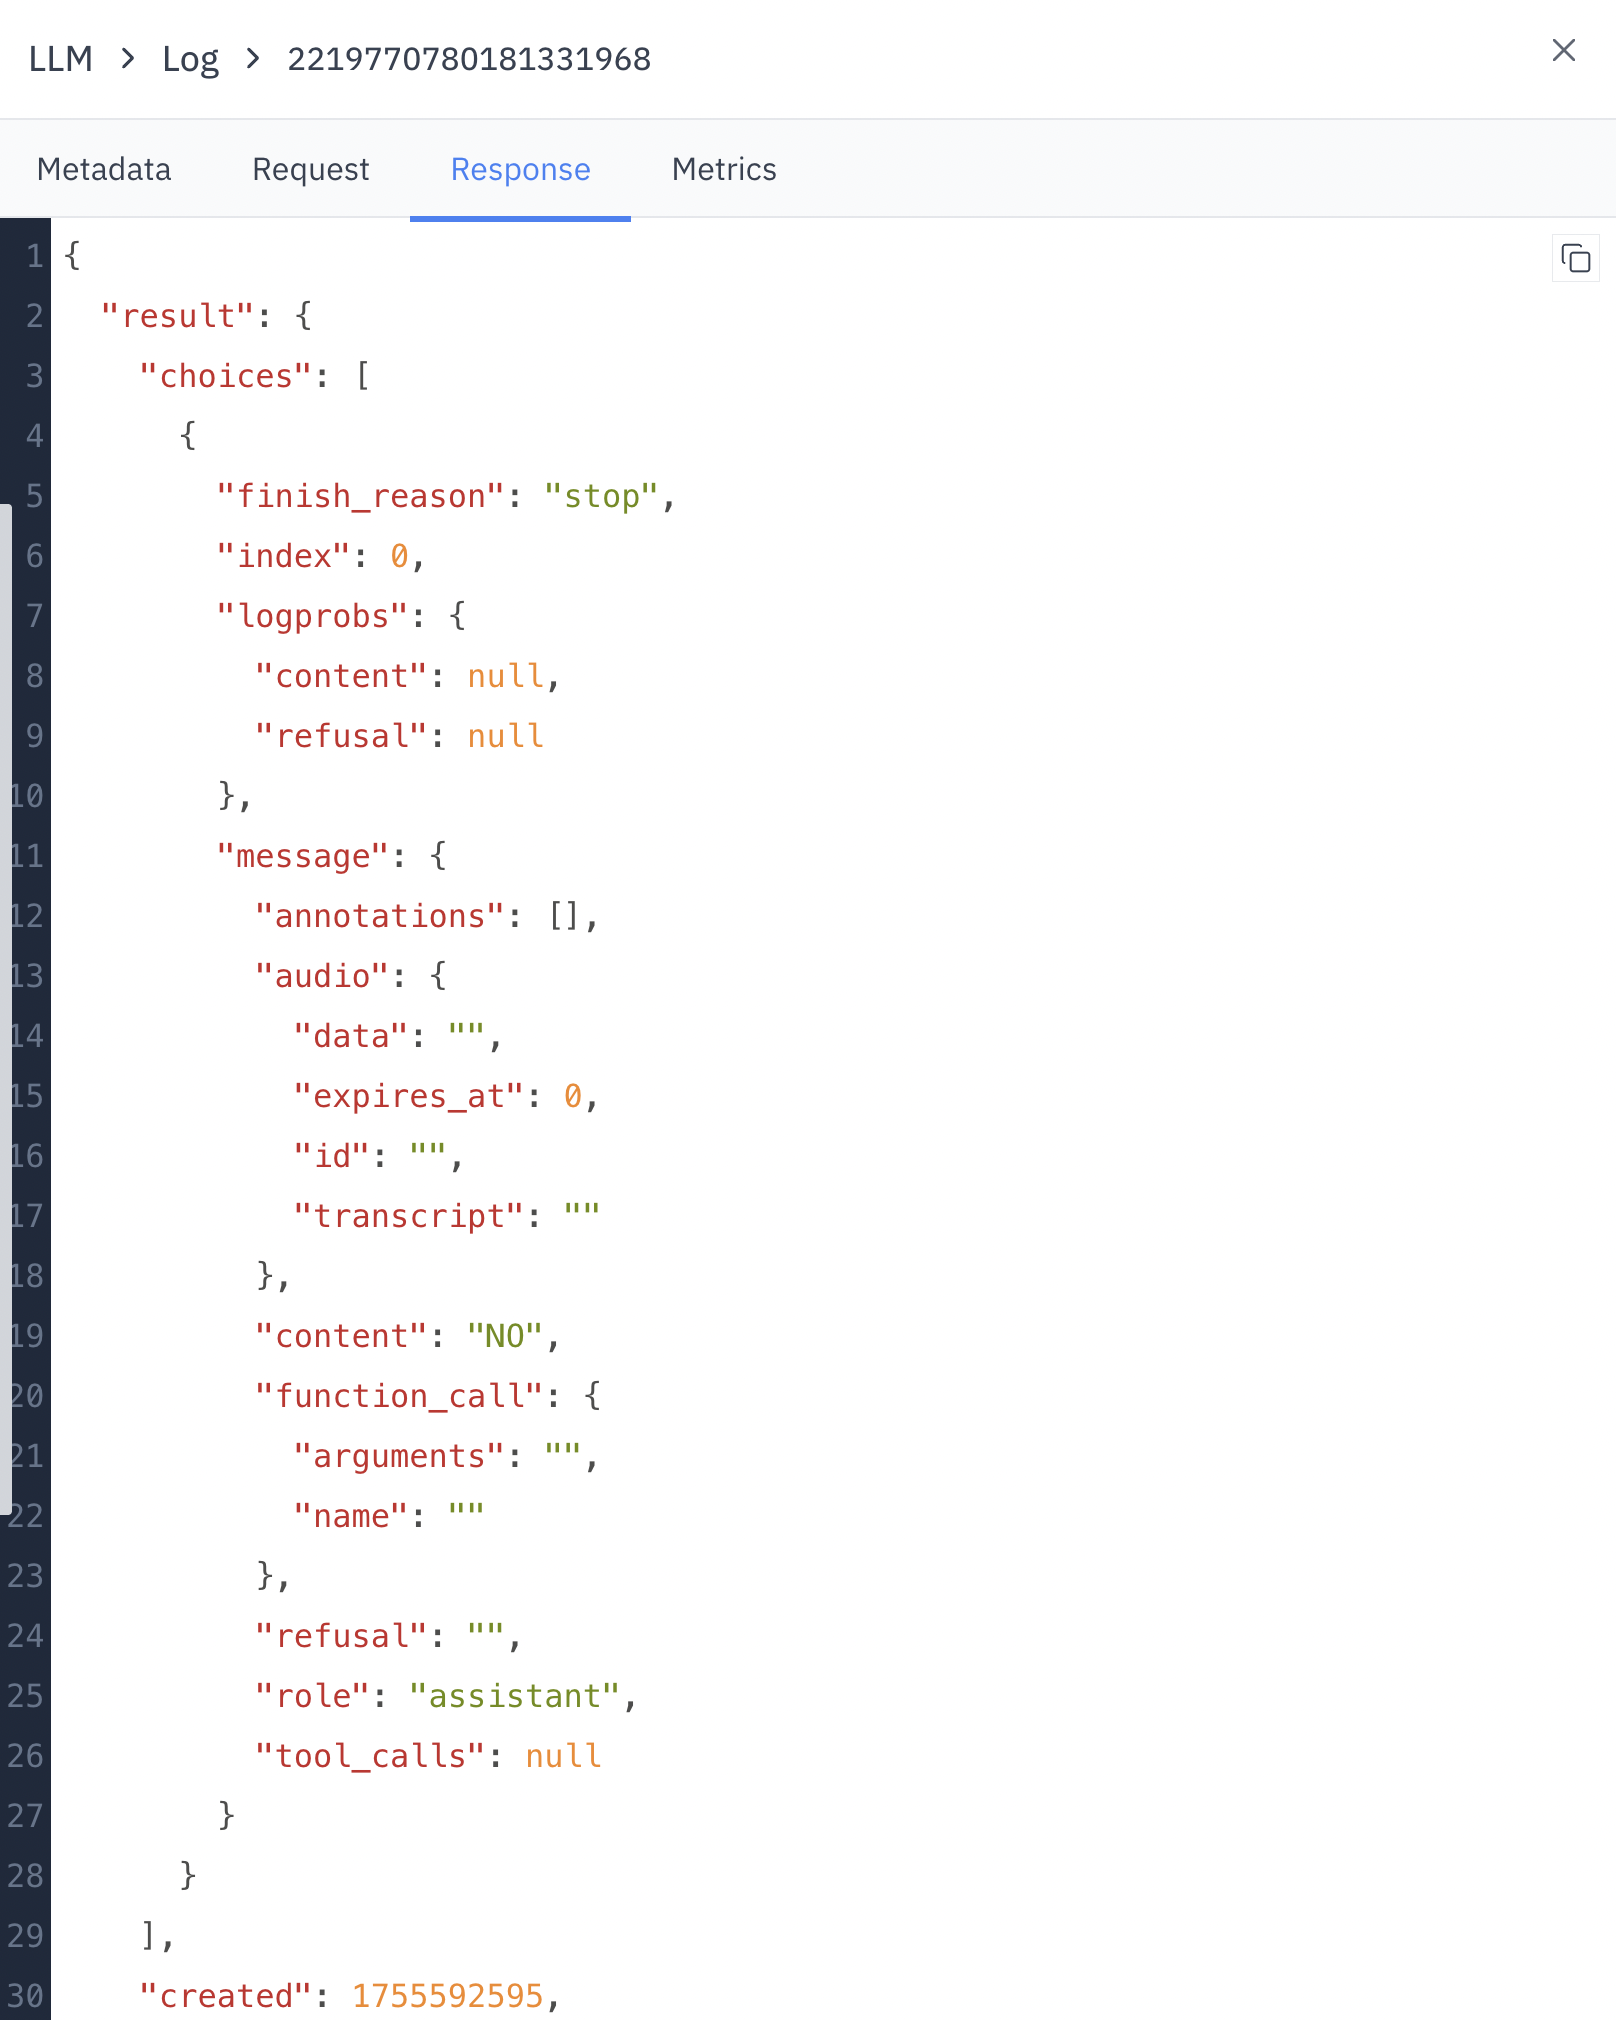 Shows the LLM's output and related metadata:
* **finish\_reason**: Why the LLM stopped generating (e.g., "stop")
* **index**: Position of the response in case of multiple outputs
* **content**: The actual text generated by the LLM
### Metrics
Shows the LLM's output and related metadata:
* **finish\_reason**: Why the LLM stopped generating (e.g., "stop")
* **index**: Position of the response in case of multiple outputs
* **content**: The actual text generated by the LLM
### Metrics
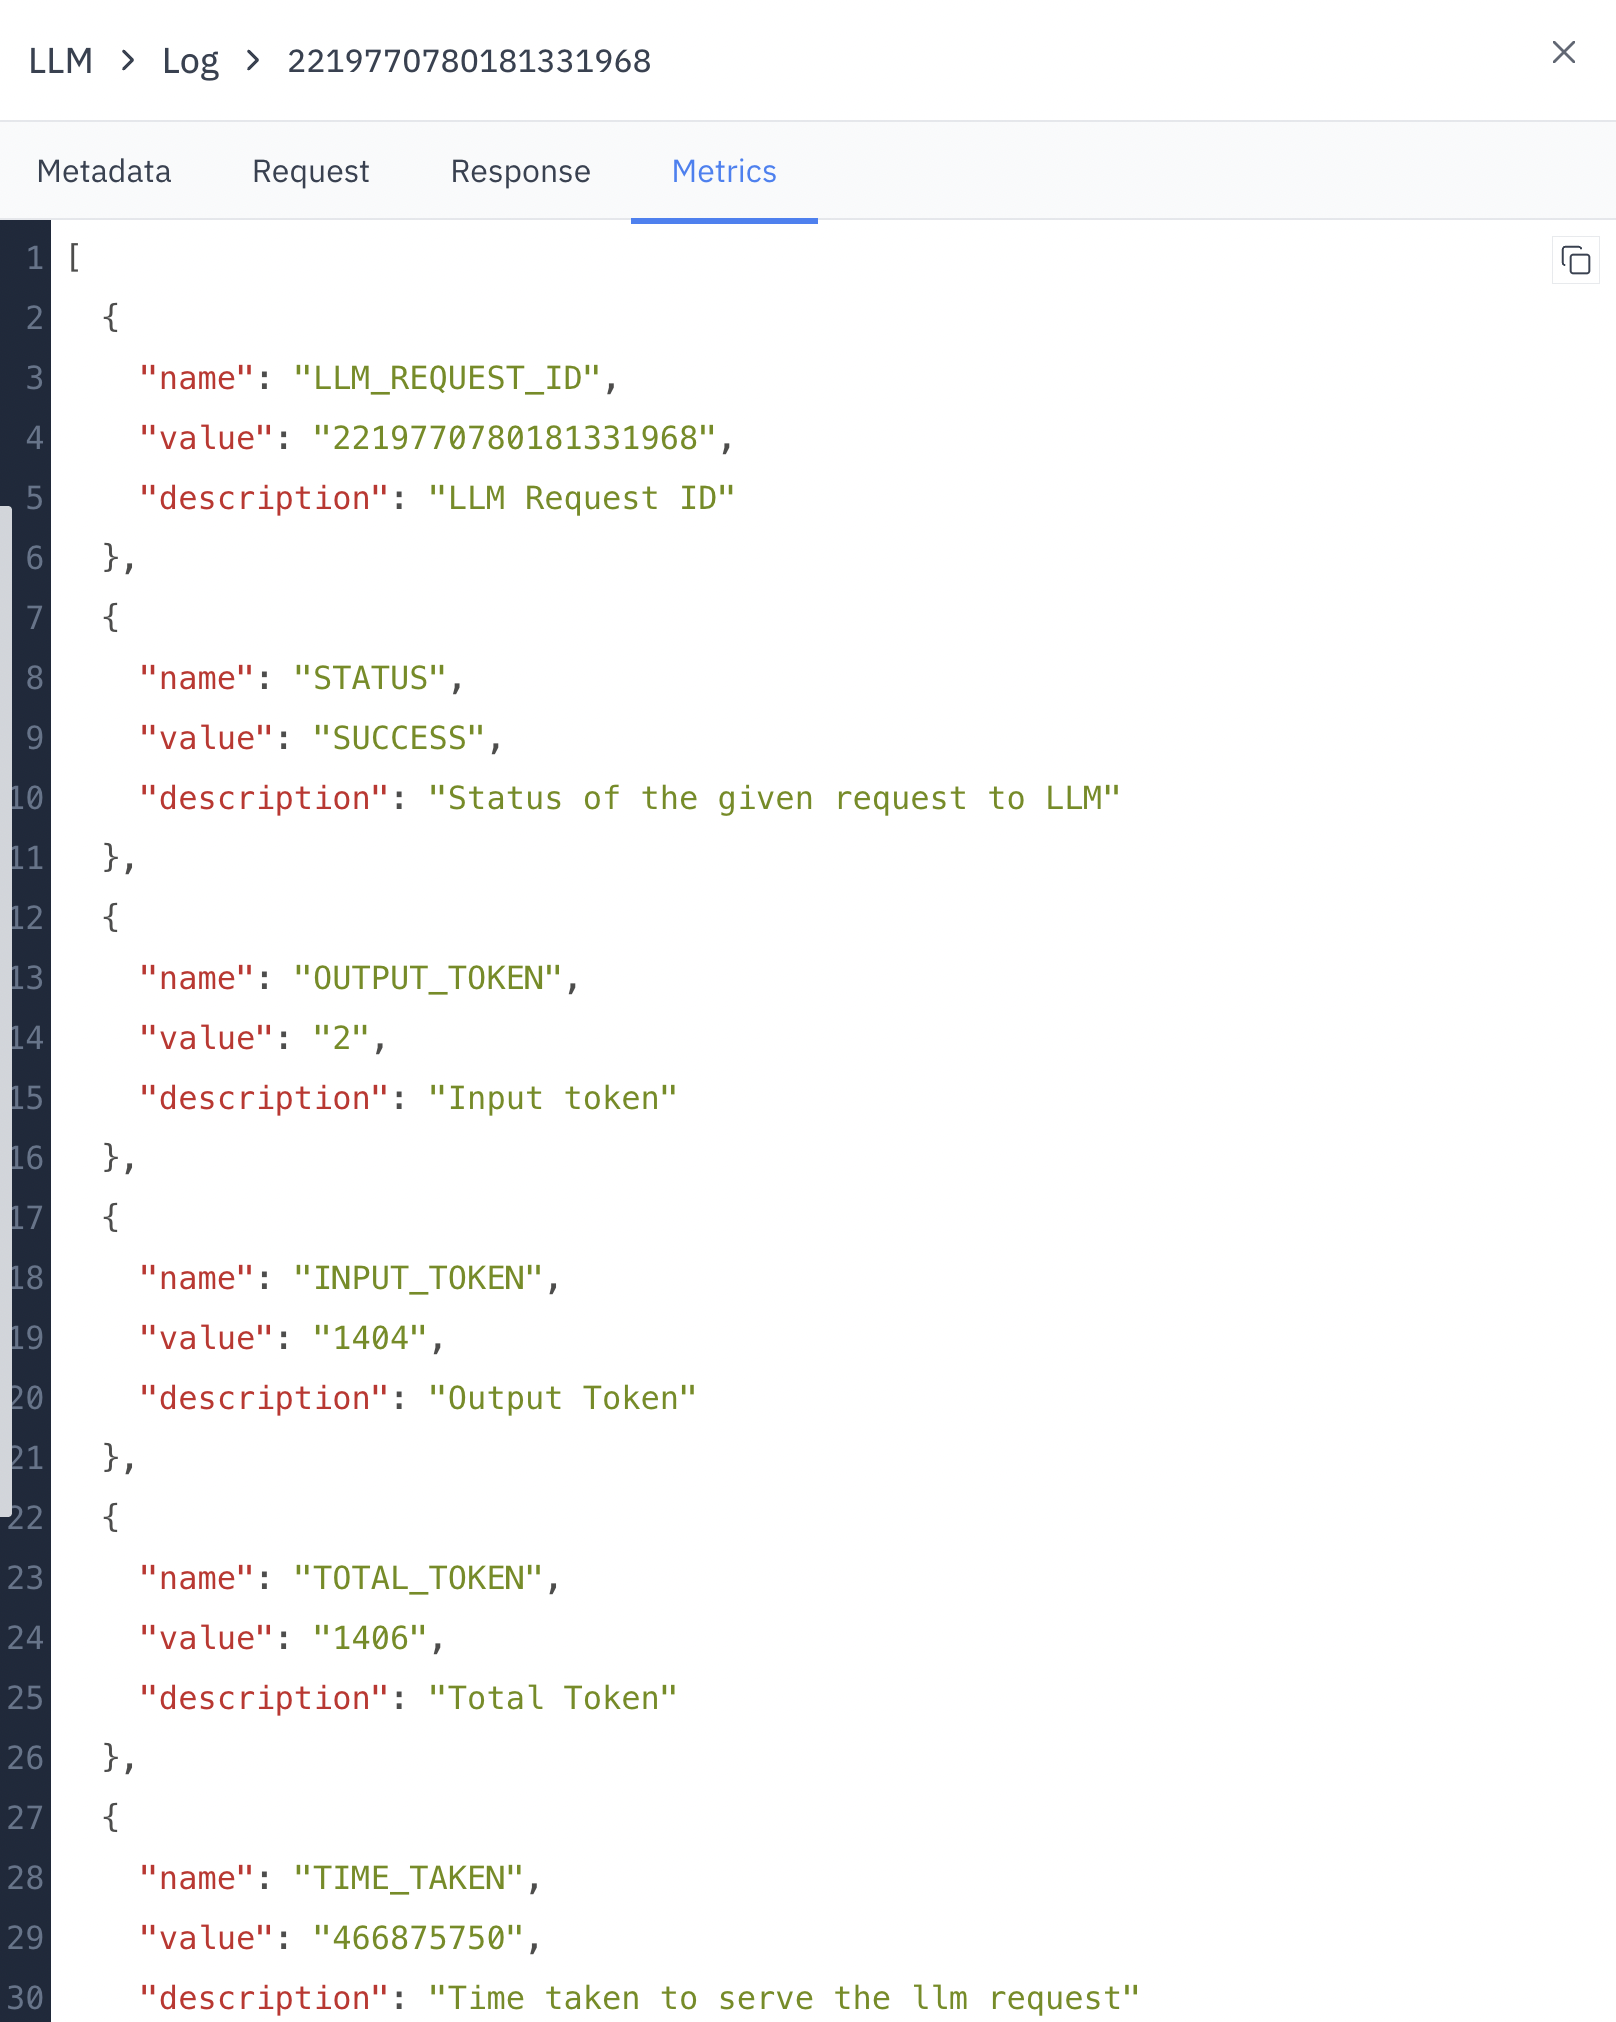 Provides additional metadata about the request:
* **Status**: Final status of the request
* **Time Taken**: Processing duration
* **Request Created Time**: When the request was initiated
* **Response Body**: HTTP status of the response
* **Endpoint Id**: Identifier for the LLM endpoint used
* **Model Id**: Identifier for the specific model
* **Provider Name**: Name of the LLM service provider
* **Vault Id**: Security-related identifier
## Using LLM Logs
1. **Performance Monitoring**: Track response times and token usage to optimize your LLM integration.
2. **Debugging**: Investigate failed requests or unexpected outputs by examining the full request and response details.
3. **Quality Assurance**: Review LLM responses to ensure they meet your application's standards.
4. **Cost Management**: Monitor token usage to manage expenses related to LLM API calls.
## Use Cases
Analyze input-output pairs to refine your prompts for better results and
efficiency.
Quickly identify and resolve issues by examining detailed error logs and
response data.
Monitor response times and token usage to ensure optimal system performance.
Review LLM interactions to maintain compliance with internal policies and
external regulations.
Provides additional metadata about the request:
* **Status**: Final status of the request
* **Time Taken**: Processing duration
* **Request Created Time**: When the request was initiated
* **Response Body**: HTTP status of the response
* **Endpoint Id**: Identifier for the LLM endpoint used
* **Model Id**: Identifier for the specific model
* **Provider Name**: Name of the LLM service provider
* **Vault Id**: Security-related identifier
## Using LLM Logs
1. **Performance Monitoring**: Track response times and token usage to optimize your LLM integration.
2. **Debugging**: Investigate failed requests or unexpected outputs by examining the full request and response details.
3. **Quality Assurance**: Review LLM responses to ensure they meet your application's standards.
4. **Cost Management**: Monitor token usage to manage expenses related to LLM API calls.
## Use Cases
Analyze input-output pairs to refine your prompts for better results and
efficiency.
Quickly identify and resolve issues by examining detailed error logs and
response data.
Monitor response times and token usage to ensure optimal system performance.
Review LLM interactions to maintain compliance with internal policies and
external regulations.